Geographic Spread and Land Coverage of MTR Mining in the Appalachians
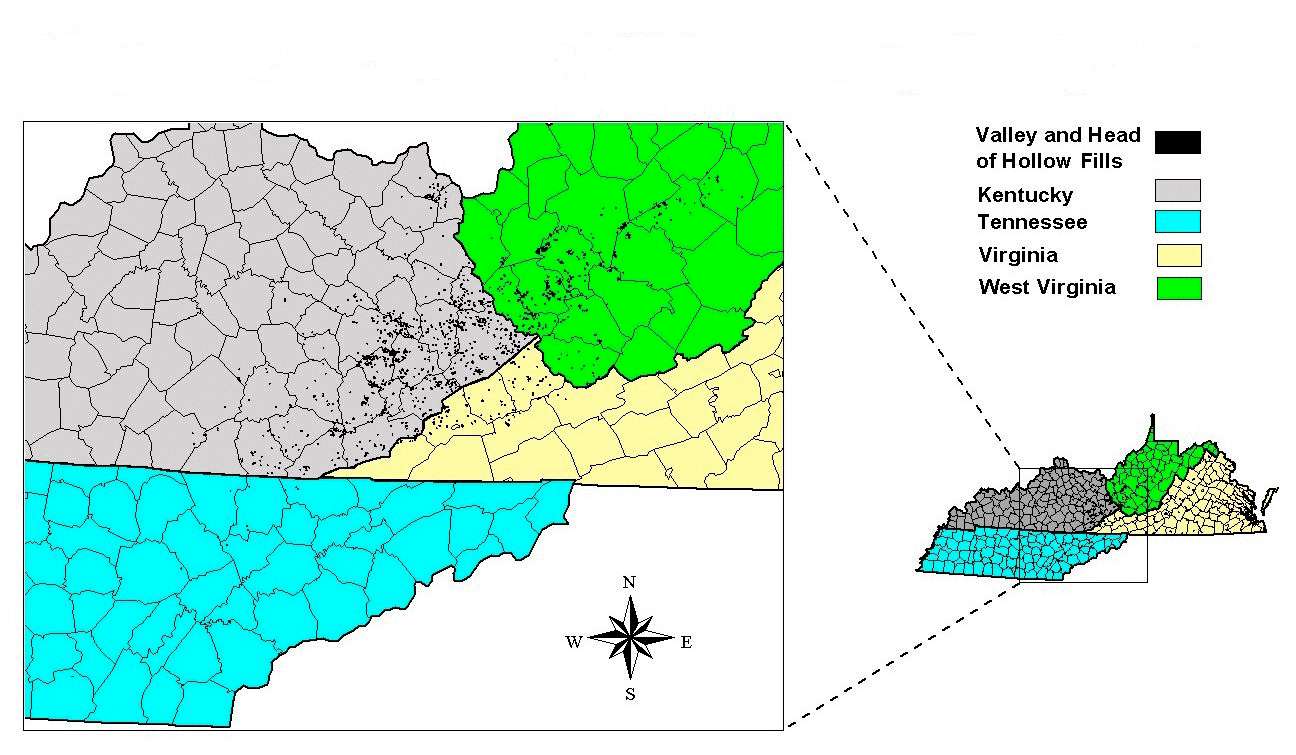
Maps are used here to give a visual appreciation of the impact of Mountaintop Removal Mining in the four most concerned states in terms of density and amount of land used.
Document created 15 December 2004, last updated 18 January 2005

A link is provided below for access to the document's full text. To read more about these maps, source data and methodology please refer to EIS Chapter 3, Page III-K-12 and after: Trends in Valley Fills (link below).
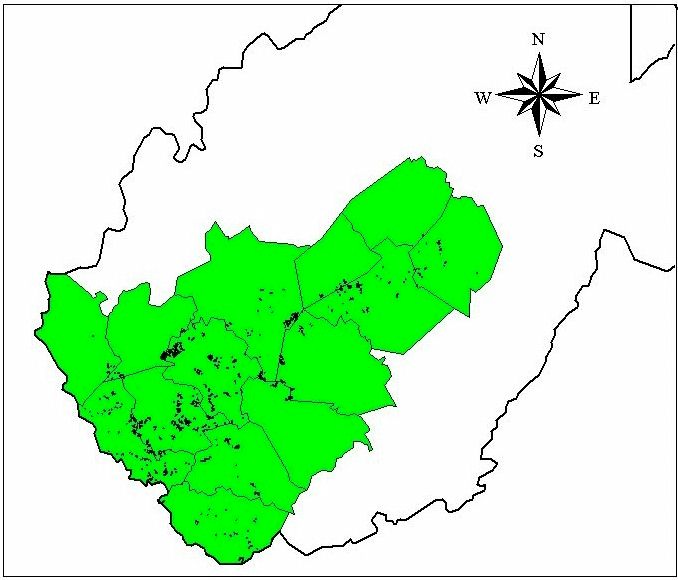
For the period 1985 to 1999 a total of 5,858 valley fills were approved in the study area. These fills covered a total of 75,072 acres (30,028 ha) of land, and are estimated to have impacted on a total of 373,187 acres (149,275 ha) of watershed. A total of 562.6 miles of stream channel are estimated to have been filled by valley fills. However other estimates of valley fills give much higher values, up to 1000 miles approximately.
For a summary of information on the impact of MTR mining in the study area, as presented in the Draft Programmatic Environmental Impact Statement please refer to the document: Mountaintop Mining to Claim Another 400,000 acres of Appalachia in this website (link provided below in contextual navigation box).
|
|
|
|
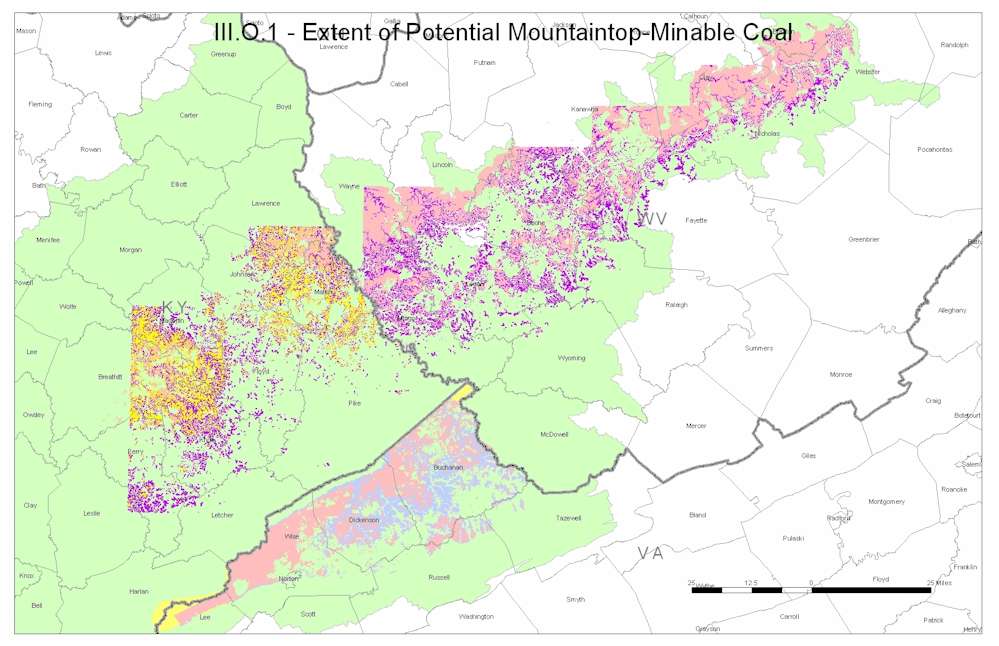
This map shows the location and extent of coal seams that could be surface mined. Due to factors such as the consistency of the coal bed, thickness, stripping ratio, coal quality, size of coal reserve block, and other factors used in site specific mining feasibility analysis, the areas that will actually be mined will likely be much smaller than the extent of the seam shown. (EIS pages III-O-1 to III-O-3)
The future extent of valley fills
The total direct stream impact from valley fill footprints for the EIS study area for the period 1985 to 2001 is 724 miles, or 1.2 % of the miles of streams within the study area . If valley fill construction continued at this historical rate documented in the Fill Inventory for the next seventeen years (2003-2020), an additional 724 miles (for a total of 2.4%) could be impacted (EIS page IV.B-2).
While these proportions of total stream mileage might appear small, it is important to note that valley fills are located almost exclusively in stream headwaters. The specific biological processes that occur in these headwaters have a direct impact on both wildlife and water quality downstream. Thus the total stream length impacted by valley fills is much larger than the basic figures given above (for additional information refer to EIS pages IV.B-2 to IV.B-6 and chapter III.D).
The future impacts to the forest environment (vegetation and soils)
During the period 1992 to 2002 a total of 380,547 acres or 3.4 % of the forest area that existed in 1992 was impacted. When adding past, present and future terrestrial disturbance, the study area estimated forest impact is 1,408,372 acres which equates to 11.5% of the study area. However these figures most likely overestimate the impacts to forest cover in the EIS study area, in particular because of the assumption that the entire area within the permit boundary would be disturbed (EIS section IV.C).
Links to external websites:
[wb1] Draft Programmatic Environmental Impact Statement - Click to access the corresponding page on the US Environmental Protection Agency's website
Comments
No comment available for this document
Ratings
Related documents Quick look
Below: the latest documents in
![]()
Open this category in Headlines for full navigation options and access to all categories and documents.
You can also use the navigation links located here in the right column.

Overview of the Valley Fill Inventory Study Area Overview of the Valley Fill Inventory Study Area. Enlarged views for each state are provided below.

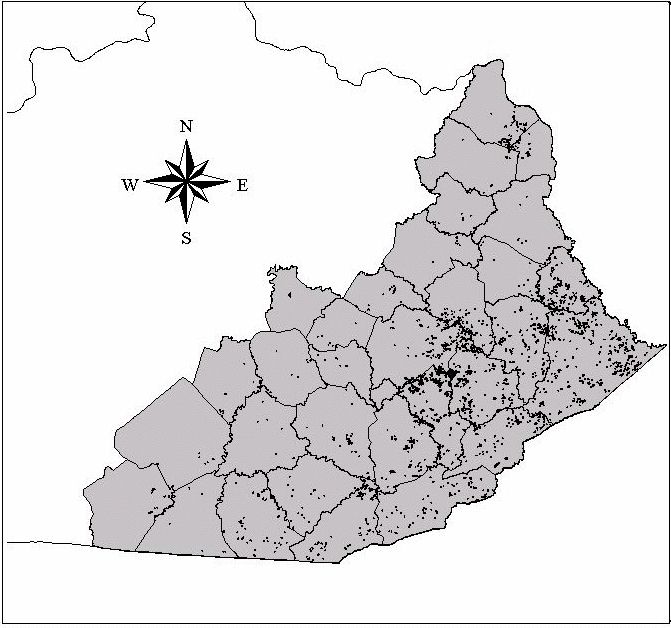
Kentucky Valley Fill Inventory Kentucky Valley Fill Inventory

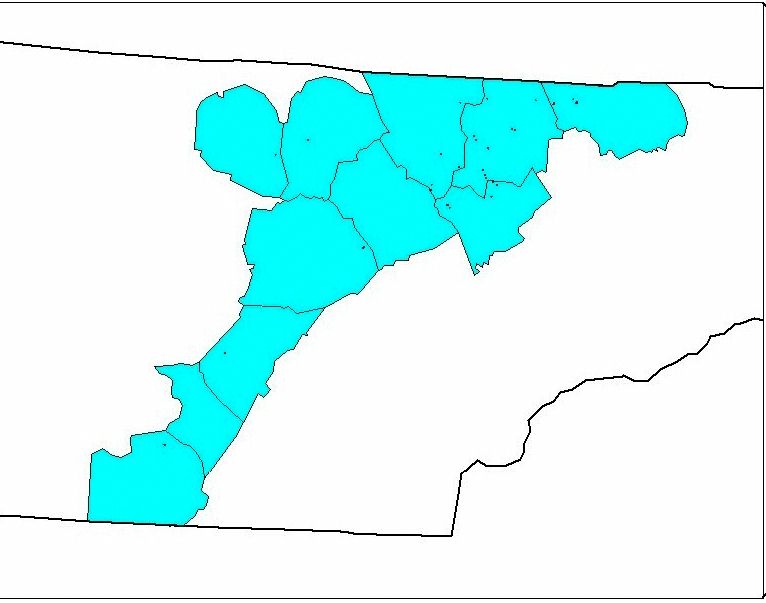
Tennessee Valley Fill Inventory Tennessee Valley Fill Inventory

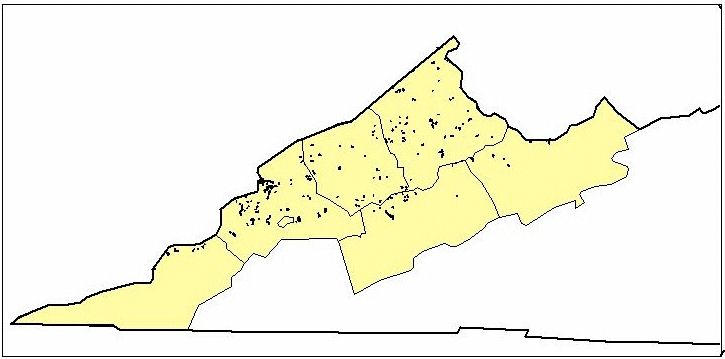
Virginia Valley Fill Inventory Virginia Valley Fill Inventory

West Virginia Valley Fill Inventory West Virginia Valley Fill Inventory

Extent of potential mountaintop-minable coal Extent of potential mountaintop-minable coal
×